Welcome.

Here is code, info, etc for Math. Code. A R T. p5.js module of Recreating the Past at MIT.

Info

I've been doing creative and/or visual coding + math stuffs since 2015 when I started working with Ira Winder in City Science at the MIT Media Lab. I have primarily done Processing and p5.js.

I post (almost) daily sketches made wtih p5.js on my Twitter.

This is a baseline p5.js module/workshop as part of Zach Lieberman's "Recreating the Past" Course at MIT.

Getting started with p5.js

p5.js is a free Javascript library for creative coding. It is super accesible, free, and open source!

You have 3 main options for creating:

    1. p5.js online editor, where you can code sketches in browser and instantly compile them! You can also make an account to like save your sketches too.
    2. Downloading the library and putting it into a sketch.js file with the library and an HTML file. Then just publishing these HTML files wherever you want on the web. Blank example for download in the repo for this module and available here. Please note, the code you edit/make is in sketch.js, do not edit the other files. index.html is the file for the browser that you would open to view the results of the sketch.
    3. Using the online editor at openprocessing.org, and sharing with that community. Super cool since you can also fork sketches from there too!

Sketch tips

Every p5.js sketch has a setup() and draw() loop. Setup runs once. Draw runs consistently and just keeps looping. If you don't want to have a looping drawing, just leave your draw() loop empty and put all your code in setup()

In general, once you have that structure, you can kind of do whatever you want. The key things to remember in general are:

    In general, don't worry if your code is sloppy or not perfect! It is ok. You really don't need to be a production ready software developer to do creative coding -- that is why we have tools.
    Give credit where credit is due. Often my sketches start as a rift from a few lines of something I see so I usually put on the top of the code file "rift from [source]". This also shows that no one does anything really in a vacuuum or alone!
    p5.js is a Javascript library but has a lot of built in functions so always check their reference!
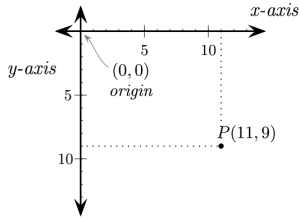
    p5.js uses a Cartesian, computer graphics coordinate system. By default the UPPER LEFT is 0, 0. x increases to the right, y increases as you go down. This is common across all of computer graphics and there are a lot of math reasons we do this, read more here.
    RGB is the default color space, but you can mess around with it with lots of color functions.
    Remember that p5.js has default alignments for primative shapes like rectangles. Check these if they are throwing off your sketches.
    In general, you are probably going to want either a polar coordinate system or rectangular/Cartesian system for sketches. So think about this in your design. Here's an example converting between.
    Object oriented programming can be super powerful in p5.js and create beautiful things and particle systems and force fields. Example 8 has an example of a Particle object if you haven't written objects in JS before.
    While p5.js does support 3D, in general, OpenGL/WebGL implementations are going to just give you more. p5.js has a 3D mode on top of these, but it's just something to keep in mind. I primarily don't do a lot of 3D things so I have very few tips for this.

Some of my favorite...functions/hacks

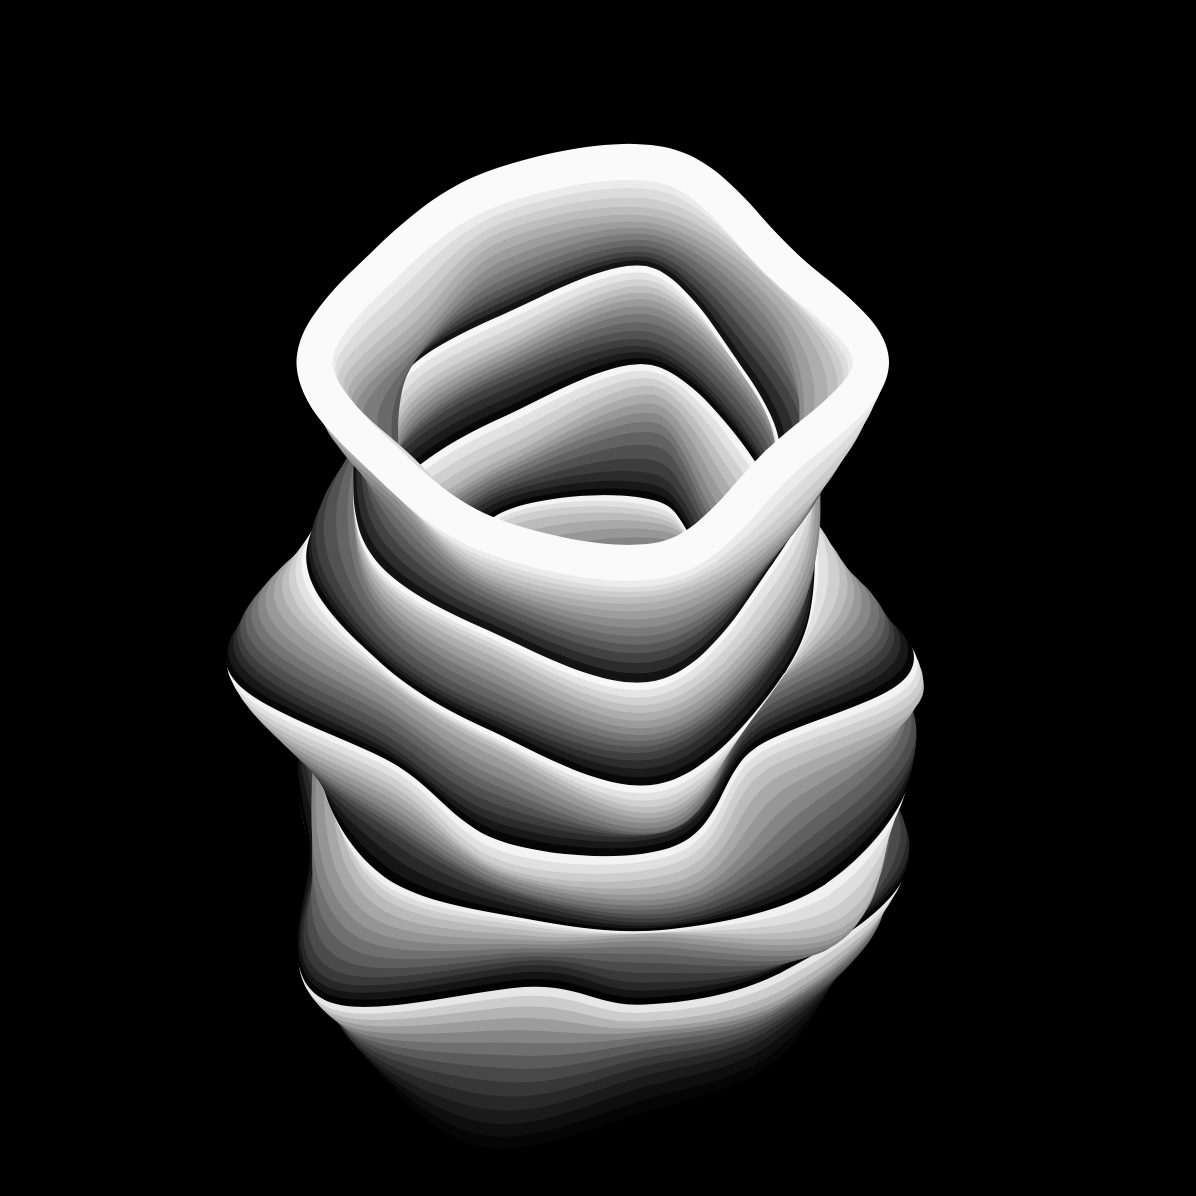
    background(255, 50) this makes a semi transparent background that gives your code a "ghost" appearance. 255 would be a white background like Example 1.
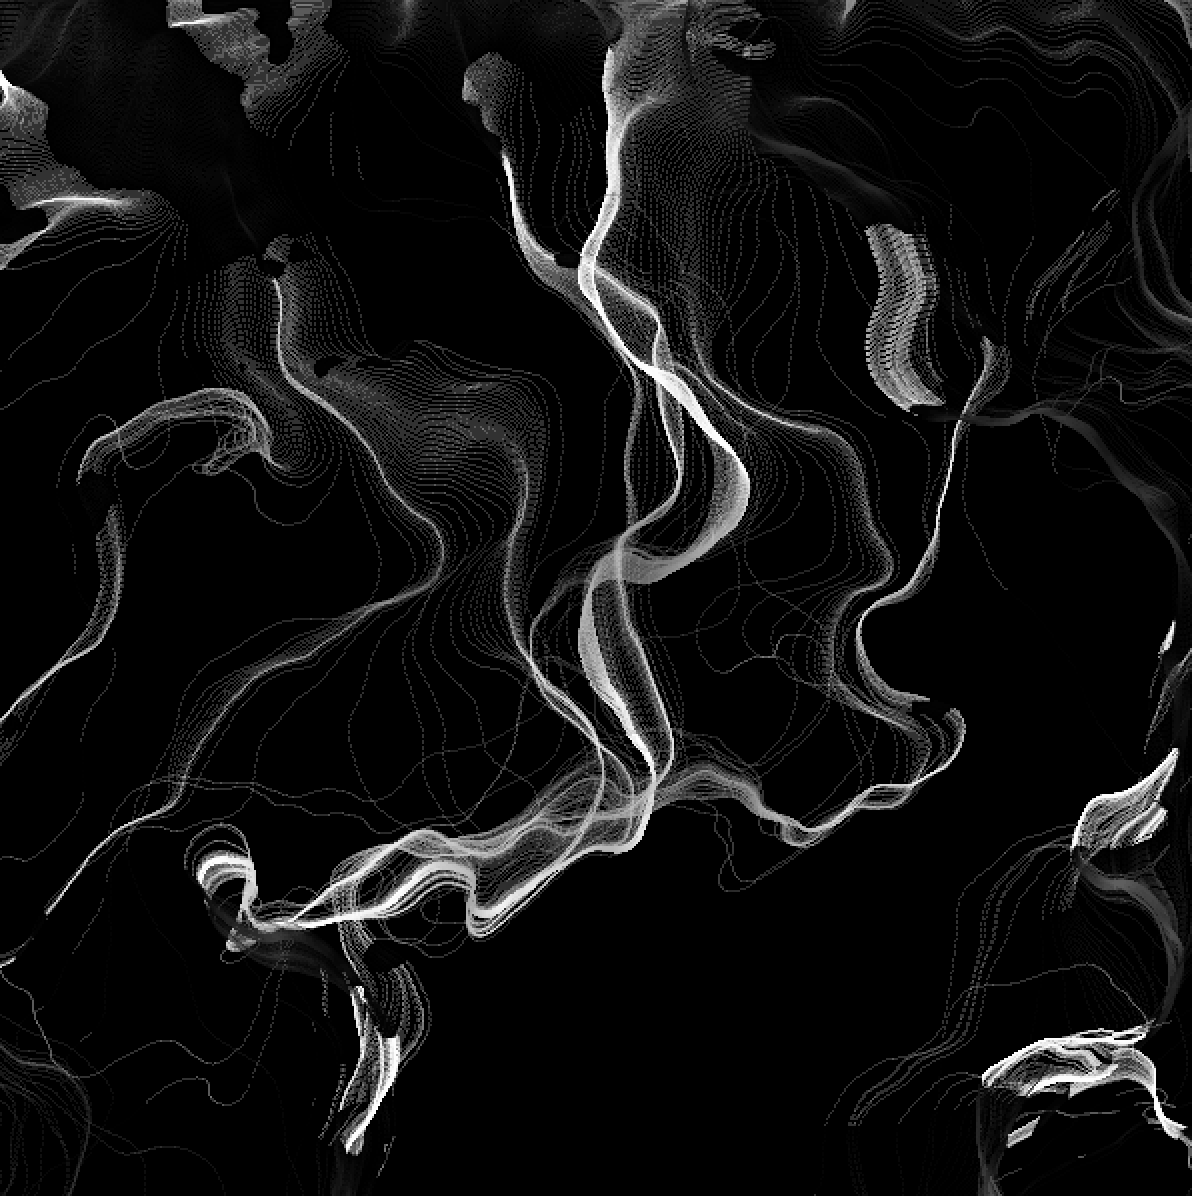
    p5.js has a built in noise() function so you don't have to write matrices to get noise! Reference here.
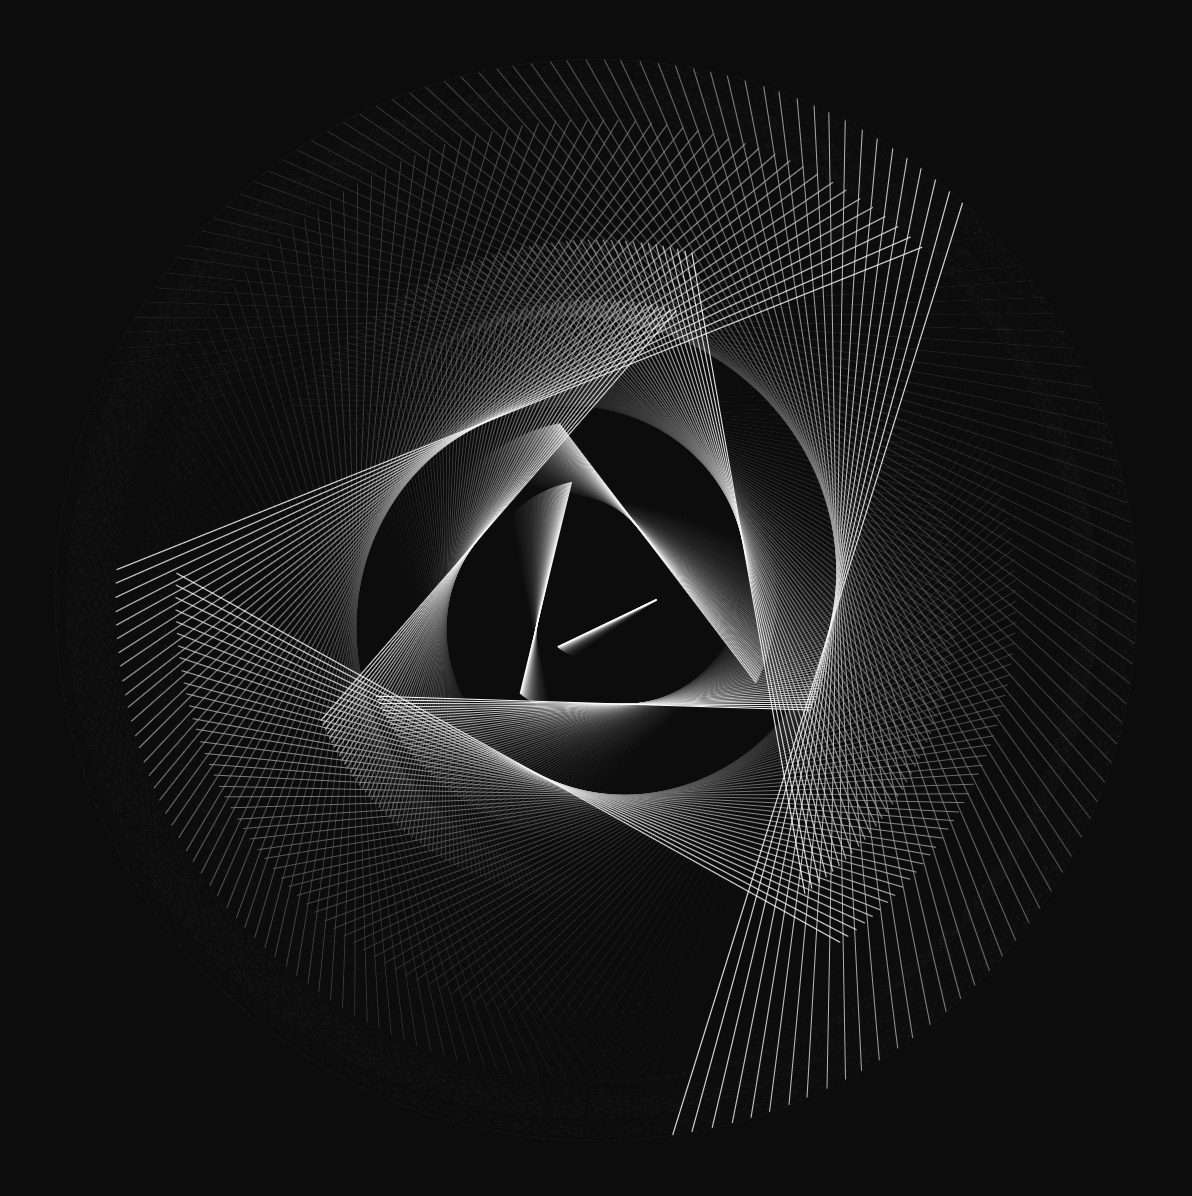
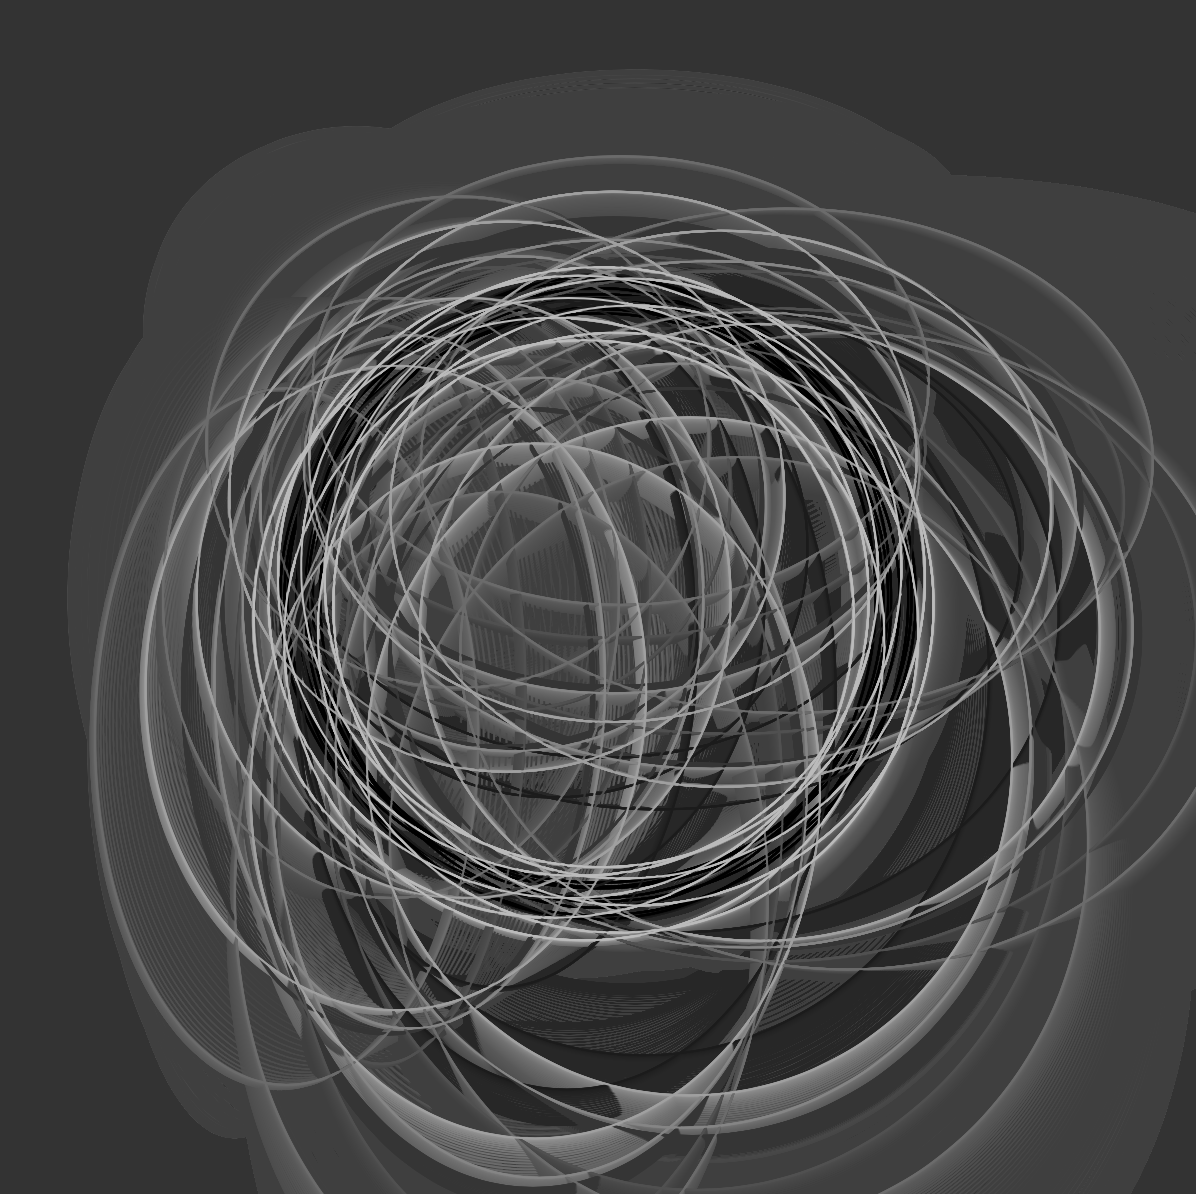
    I love creating movement with sinusodial functions and also creating weird shapes with tau (2*pi). Example 5 shows an example of tau being used to create weird, noisy curves. Example 4 shows some cool sin/cos curves.
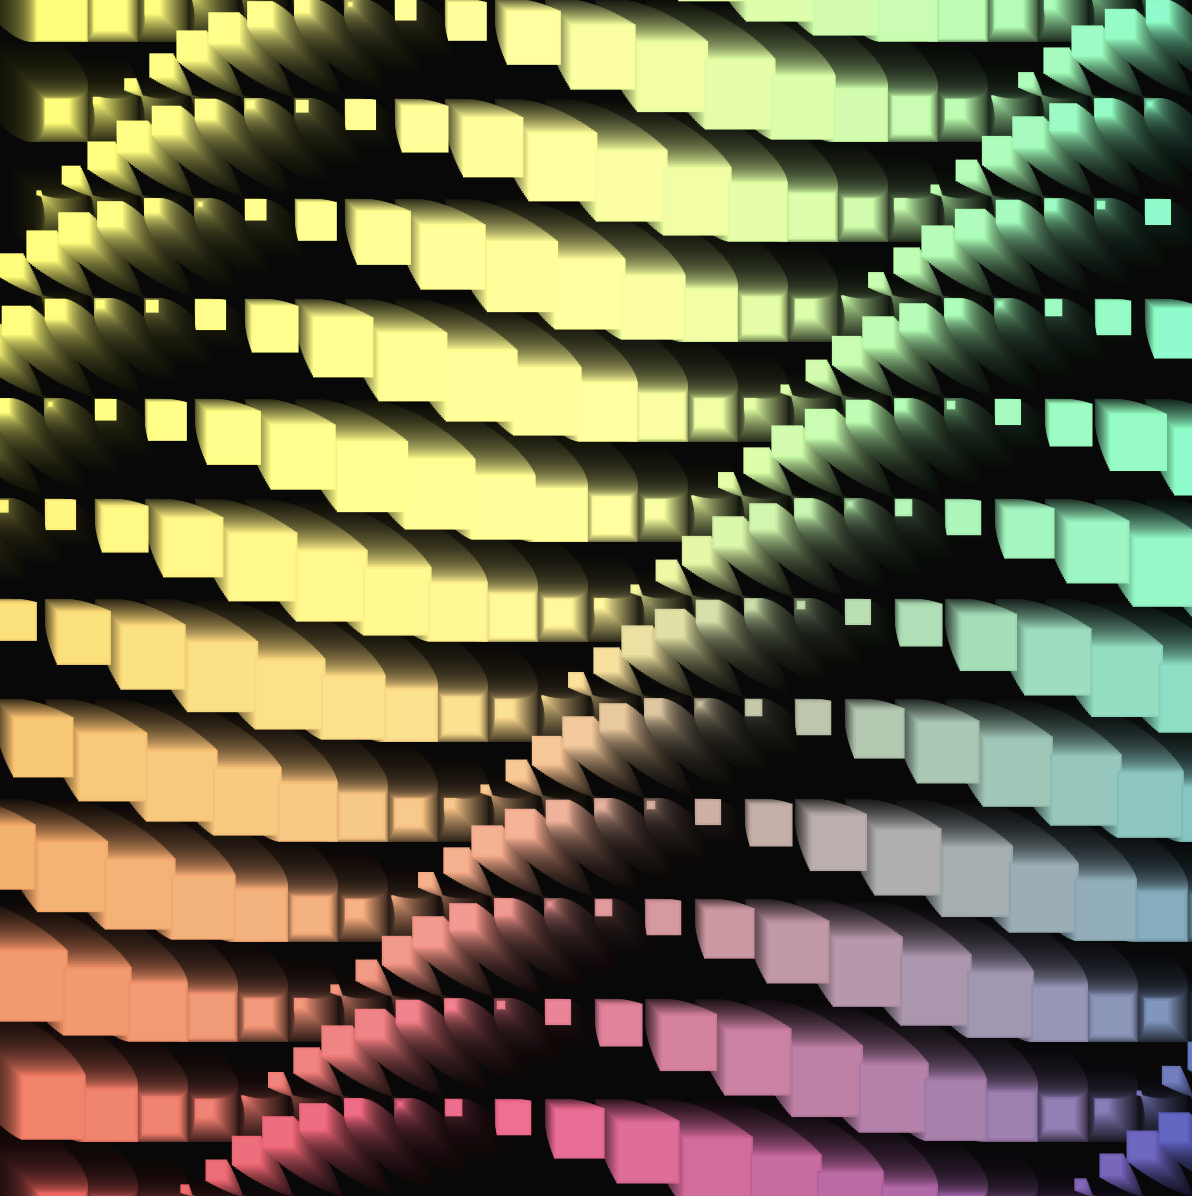
    map(value, start1, stop1, start2, stop2) is a function that allows you to linearly interpolate between value ranges. Used for color + coordinates. lerpColor(startColor, endColor, percent) lets you do this a bit easier for colors.
    createVector() a lot of my sketches are vector based and what's great about creating a vector is you can do vector math like adding forces and velocities. Reference here.
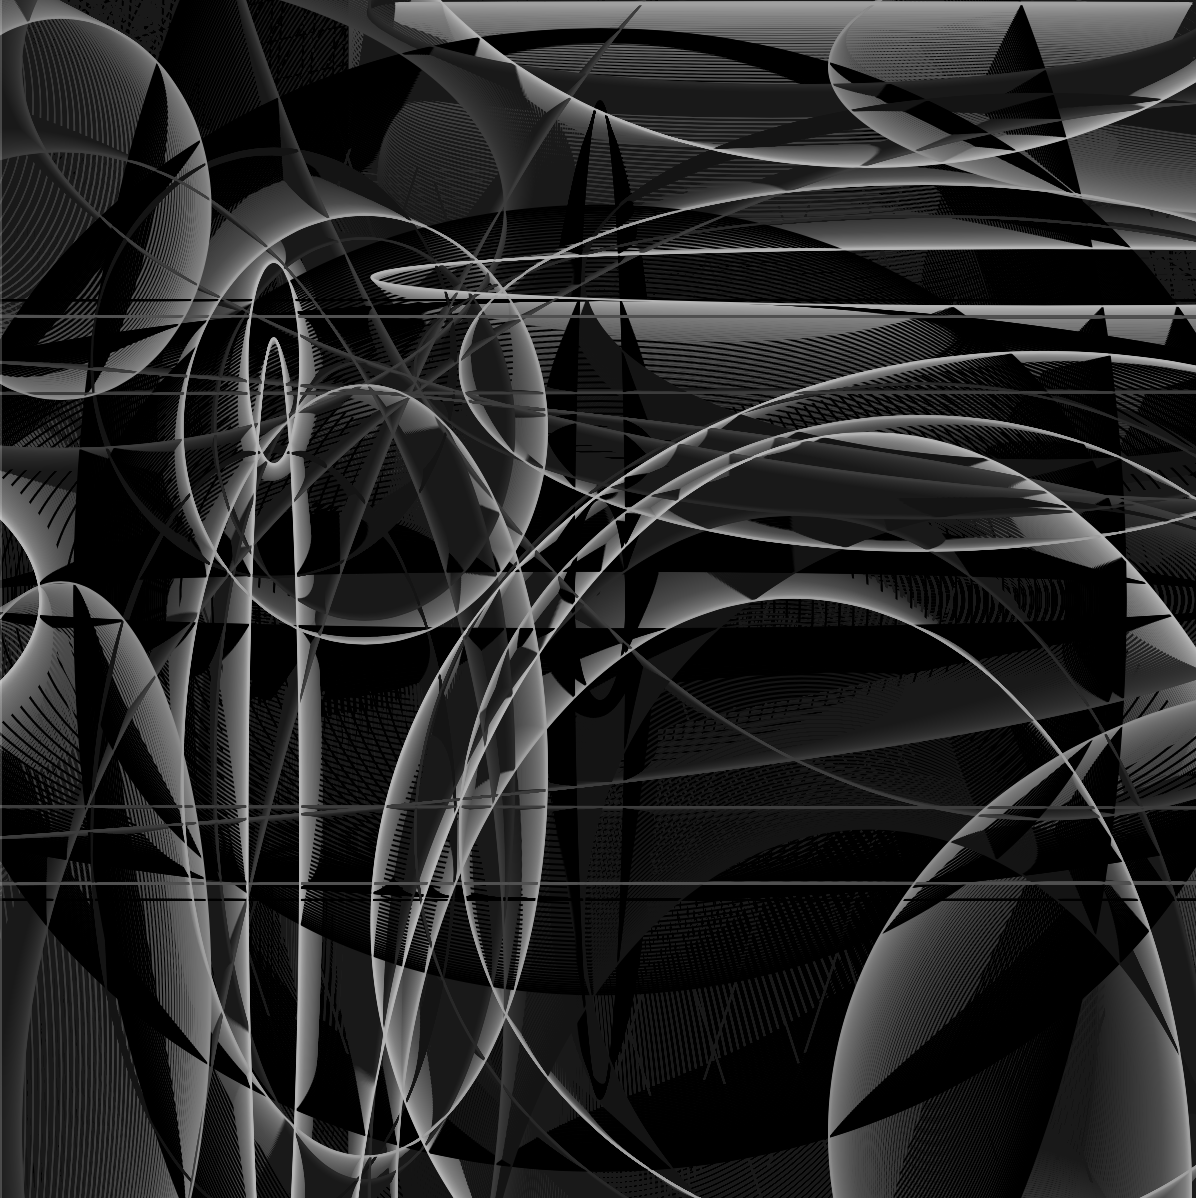
    curveVertex() allows you to build more complex geometries overall. Refence here. Example 4 also has an example of this.
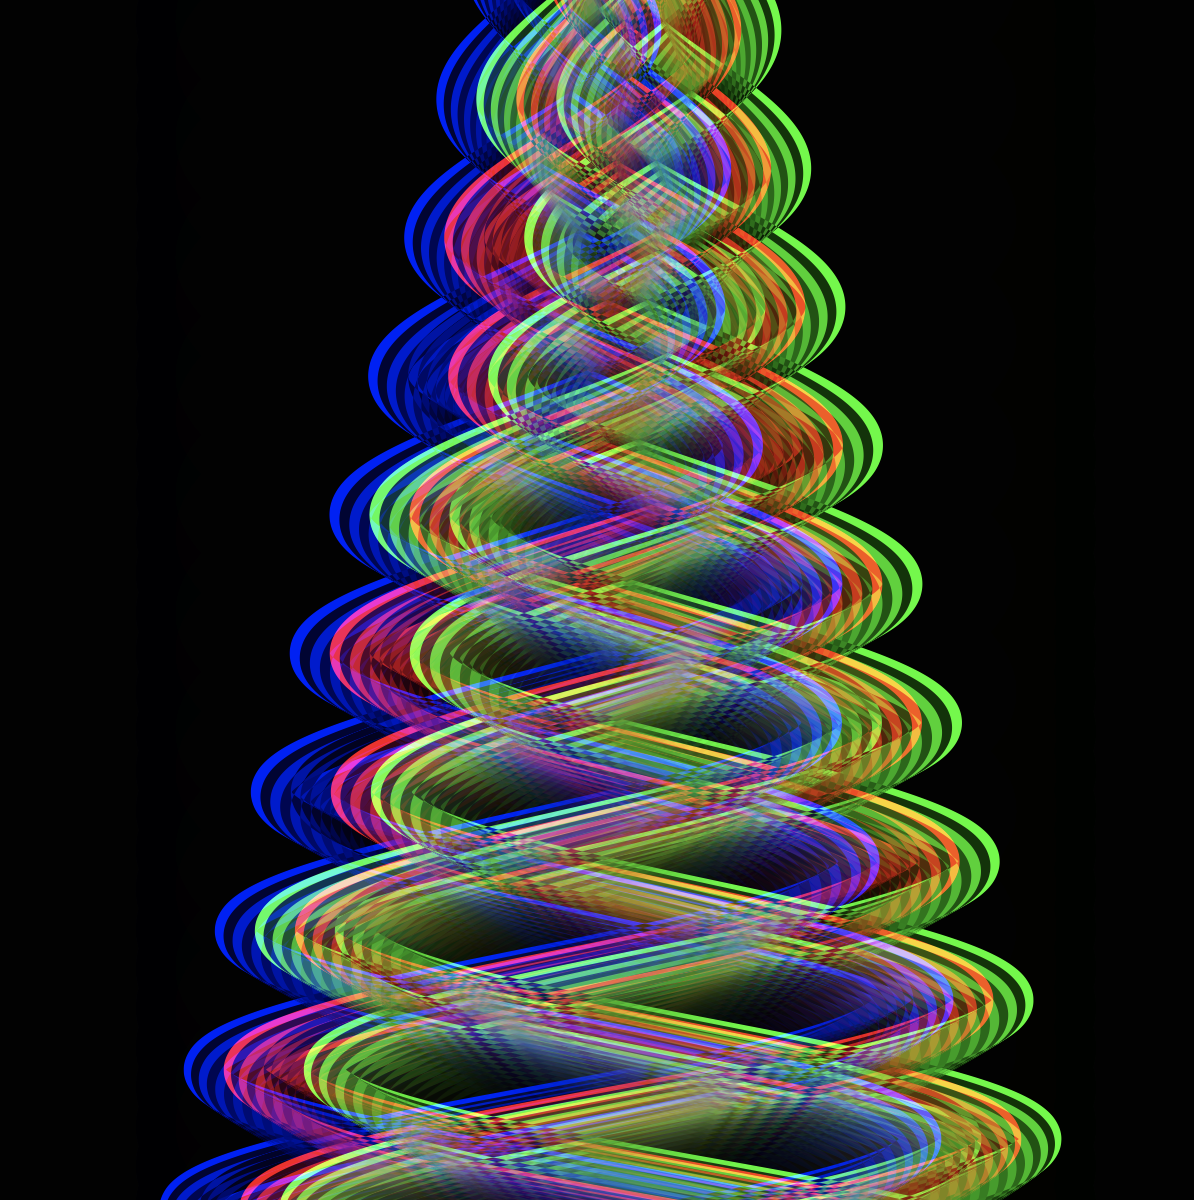
    blendMode() is a super easy way to start playing with color and pixel blending without writing any code. Reference for all the modes is here . I personally love using EXCLUSION to get a glitchy look.

Resources/Help/Documentation

The p5.js website really is the best place to get help/documentation. In particular they have a learn page with more code explanations and also a documentation/reference page for quick lookups and an examples page.

There are a lot of amazing people in the space that do tutorials and content for this work and code alongs and have lots of tutorials. Daniel Shiffman is a great person to look at for these.

There is also just an amazing community around this space, which I encourage people to look into. There are creative coding clubs and scenes all over the world, and a lot of them are welcoming to everyone and newcomers!

Code/Downloads from this module

All of the code of the examples on this site is in this repo, including a blank p5.js sketch template here

I am, in general, trying to get better at documenting things and making more tutorials and tutorial like materials, so feel free to check back on my Twitter as I post things.

Example 1:

Download source to view it. Click picture to see sketch run/move in browser page.

Feel free to copy/paste this code below and play with it in an online editor if you want. This is just to illustrate that it doesn't take a lot of code to make some beautiful.

//Set up 2 global vars
var r=200; //radius
var s=0.002; //speed

function setup() {
   createCanvas(600, 600);
   background(255)
}

function draw() {
   background(255, 150);
   translate(width/2, height/2);
   let n=360;
   for (let i=0; i<n; i++) {
      let t1= i*2*PI/n;
      let t2= s*t1;
      let x1= r*cos(t1);
      let y1= r*sin(t1);
      let x2= r*cos(t2);
      let y2= r*sin(t2);
      stroke(i%255, 50)
      strokeWeight(0.2)
      noFill();
      line(x1, y1, x2,y2);
   }
   s+=0.002;
   fill(0);
}

Example 2:

Download source to view it. Click picture to see sketch run/move in browser page.

Example 3:

Download source to view it. Click picture to see sketch run/move in browser page.

Example 4:

Download source to view it. Click picture to see sketch run/move in browser page.

Example 5:

Download source to view it. Click picture to see sketch run/move in browser page.

Example 6:

Download source to view it. Click picture to see sketch run/move in browser page.

Example 7:

Download source to view it. Click picture to see sketch run/move in browser page.

Example 8:

Download source to view it. Click picture to see sketch run/move in browser page.